Posts

Showing posts from March, 2019

#6 Splunk sub(Commands) [fields, rename, replace, table, transaction]

FIELDS:  This command helps to keep or remove specified fields from the search results, below command will keep just three fields in your search result. Example: | fields request, rc, pt RENAME:  This command helps to rename field(s), below command will rename a field named as service to serviceType and RC as responseCode Example: | rename service AS serviceType, RC AS responseCode REPLACE:  This command helps to replace the values of fields with another value, below command will replace the values "fetchReport" and "viewReport" as "Report" in "serviceType' field. Example: | replace fetchReport with Report, viewReport with Report in serviceType TABLE: This command helps to format the results into tabular output. Example: | table request, rc, pt TRANSACTION:  This command helps to merge events into a single event based upon a common identifier, below command will create events based on two events i.e. it will fetch the txn-id w

#5 Splunk sub(Commands) [sendemail, dedup, eval, concatenate, new_field]

SENDEMAIL:  This command helps you to send an email straight away from the search head itself. you just need to pass couple of values to it. For instance to whom you want to send the email, if you want to keep anyone in cc/bcc, change the subject line (by default its "Splunk Results"), sendpdf(true or false) i.e. the results, set the priority of the email, give a message i.e. the body(if required). Example: | sendemail to ="XYZ@gmail.com" subject ="Test Search Results" sendpdf =true priority =highest message ="Please find attached latest search result" sendresults =true DEDUP:  This command helps de-duplicate the results based upon specified fields, keeping the most recent match. Example: | dedup txn-id EVAL:  This command helps to evaluate new or existing fields and their values. There are multiple different functions available for eval command. Lets say you want to add a new field, for doing so you can use something like given belo

Enable receiving port on Splunk server

Image
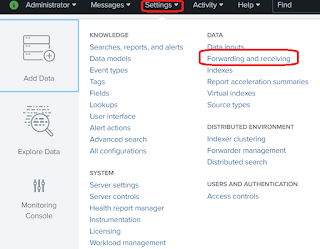
Prerequisite: Make sure the port number which you are adding is open and allowed to receive data. There are multiple ways to accomplish this, lets go one by one: CLI: Simplest and easiest way to add a port is via command line interface, you just need to traverse to $SPLUNK_HOME/bin directory and using the splunk universal binary you can do that. [splunk@ip bin]# ./splunk enable listen 9999 Splunk username: admin Password: Listening for Splunk data on TCP port 9999. Above command will require your Splunk admin credentials for adding/enabling the mentioned port number.  PS: If you want to disable it simply use disable instead of enable i.e. ./splunk disable listen 9999, basically what it does it adds a flag in your stanza and mark it as 1 < disabled = 1 >. Basically under the hood what is does, it creates a stanza in your inputs.conf  [splunktcp://9999] connection_host = ip Config file:  Another way to do it, is via manually editing the conf

Bringing data into Splunk (Continued...)

What happened behind the hood? When we added the new log file to be monitored via the graphical interface, it created and added a configuration item into inputs.conf configuration file. You can find the configuration file here: $SPLUNK_HOME/etc/apps/search/local/inputs.conf You can also manually edit this file and add your custom stanza, once done to notify Splunk about the changes, the daemon needs to be restarted. It will contain something like this: [monitor:///var/log/messages] disabled = false host = splunk_server index = idx_messages sourcetype = linux_logs Above block is known as stanza, lets decipher this :)  monitor: This is used to specify which logfile(s) you want to monitor i.e. you can mention a specific logfile as well as full directory lets say you want to monitor everything under /var/log directory, just mention "monitor:///var/log/" and Splunk will try to index everything which is there in that directory. disabled: Lets say you w

Bringing data into Splunk

Image
Now, lets dive deep into bringing data into Splunk. Splunk Enterprise can index any type of data, however it works best with data with timestamps. When Splunk indexes data, it breaks it into events based on timestamps. Every event or data which is indexed into Splunk should have a sourcetype ( helps to identify the type of data which is indexed ) assigned to it. In corporate environment, majorly forwarders ( ref: here ) are used to input data into Splunk but there are other ways as well in which you can get your data indexed to Splunk. Lets assume you want to monitor a log file of the local machine on which Splunk is installed then you can use the hyperlinks which are listed under "Local inputs" otherwise you can use the hyperlinks which are listed under "Forwarded inputs". For achieving that, you can navigate to "Settings" => "Data Inputs" => "Local Inputs" => "Add New" (NOTE: Make sure Splunk have a

#4 Splunk sub(Commands) [timechart, geostats, iplocation]

Image
TIMECHART : Helps you to create a time series chart with respect to event statistics. Example: index=_audit | timechart span =5m count by action useother=f Above query will help to create a timechart with respect to an specific field(it this case its action) from the events. If you will notice, there is something called span (length of time for which the statistics are considered). In this case each bar(or line chart) in bar graph will be of 5 mins. Another things to notice is useother, this option specifies whether to merge all of the values which are not included in the results into a single new value called OTHER, accepted values t(true) or f(false). Statistics, will help you to see a table consisting of all the statistics fetched based on your query. Visualization, will help you to see the timechart. Select Visualization, helps you to select your preferred visualization type. GEOSTATS : Helps to create a cluster map based on your events. Example: ind

#3 Splunk sub(Commands) [eval, round, trim, stats, ceil, exact, floor, tostring]

Image
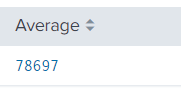
ROUND: Eval with round takes one or two numeric arguments, returning 'first value' rounded to the amount of decimal places specified in 'second value'.  By default it will remove all the decimals. Example: index=idx_messages sourcetype=linux_logs | eval new_rt= trim ( replace (response_time, "ms.", "")) | stats avg (new_rt) as Average | eval Average= round (Average) Remove all the decimal values. Example: | eval Average= round (Average,3) Rounded the value up-to 3 decimal places. Example: | eval Average= ceil (Average) Round the value up-to the next highest integer. Example: | eval Average= exact (Average) Give the output with maximum possible number of decimal values. Example: | eval Average= floor (Average) Round the value down to the nearest whole integer. Apart from this, there are other functions as well which are used by eval command, for instance pi (), sqrt () etc. TOSTRING: Hel

#2 Splunk sub(Commands) [eval, trim, chart, showperc, stats, avg]

Image
TRIM: Basically it helps you to create more meaning full data from existing data i.e. it helps you to remove noise from the results. Example: index=idx_messages sourcetype=linux_logs | eval new_rt= trim (replace( response_time , "ms.", "")) In above example, response_time is an existing field which consists of some unwanted data like "ms." which we don't want. So, by using eval and trim we can remove that unwanted data. If you will notice, above search will create a new field called new_rt which contains our intended results i.e. without "ms." CHART: It basically results your finished data in a table format, further that data can be used to visualize via different mechanism. Example: index=idx_messages sourcetype=linux_logs | chart count by date client useother=f Honestly the example is not so good but I believe, you are able to reach to the crux of it, i.e. it will show you which client on which date made how ma

#1 Splunk sub(Commands) [top, rare, fields, table, rename, sort]

Image
TOP: Will show you top results with respect to your field. Example: index=_internal | top limit=5 component RARE: Will help you to find out least common values of a field, i.e. it is similar to TOP but works in opposite direction. Example: index=_internal | rare limit=5 component FIELDS: Will help you to limit your columns, lets say you want to remove count from above table, fields can help you to achieve that. Though there are other usage of fields as well but you will learn slowly and gradually when you start building some complex queries. Example: index=_internal | top limit=5 component | fields component, percent TABLE: Same thing can be achieved via table as well. Example: index=_internal | top limit=5 component | table component, percent RENAME: Lets say you want to rename a column, for that you can use rename command. Example: index=_internal | top limit=5 component | rename percent AS percentage | t

Searching in Splunk

Image
Searching on Splunk is quite simple. Just login to your Splunk Enterprise installation, navigate to App: Search & Reporting . It will bring you to a new web page which is basically our search head. Type in your query and you are done. All your events which matched your query will be presented on your screen, If you will notice below, the query which I have used have nothing much its just searching all the events from "idx_messages" index < remember we added a monitor on one of our remote host to forward the data to idx_messages index   >. Based on above search it resulted in 1068 events in last 7 days. Field names are case sensitive. Field values are not case sensitive, if used without single quotes. i.e. below queries with give us same results: index=idx_messages date_wday=monday  index=idx_messages date_wday=MONDAY index=idx_messages date_wday="MONDAY" But if I use below query it might not give me

Walkthrough of Splunk Interface

Image
Walkthrough of Splunk Interface Accessible on port 8000 (default) Once installed, it will have some basic applications pre-installed. Contains a wide variety of hyperlinks/tabs to manage and play with you Splunk installation. If you need any sort of help, go to the help menu and there you can find couple of handy options like official documentation etc. Best part is, if you are stuck somewhere go to "Splunk Answers" and shoot your query. Splunk community is quite active and surely will help in getting your issue resolved.

Installing Splunk Universal Forwarder?

Image
Installing Splunk Universal Forwarder? Navigate to https://www.splunk.com/en_us/download/universal-forwarder.html Login to splunk.com if not done already. Choose  the OS for which you want to download the forwarder. In my case I will be using amazon linux, so I will choose a .rpm package. Download and save on the machine from which you want to send the logs to your Splunk enterprise installation. In my case its splunkforwarder-7.2.4-8a94541dcfac-linux-2.6-x86_64.rpm [splunk@ip tmp]$ sudo rpm -ivh splunkforwarder-7.2.4-8a94541dcfac-linux-2.6-x86_64.rpm [sudo] password for splunk: warning: splunkforwarder-7.2.4-8a94541dcfac-linux-2.6-x86_64.rpm: Header V4 RSA/SHA256 Signature, key ID b3cd4420: NOKEY Preparing...                          ################################# [100%] Updating / installing...    1:splunkforwarder-7.2.4-8a94541dcfa################################# [100%] complete [splunk@ip tmp]$ Once installed you will find your installation here

Installing Splunk?

Image
Installing Splunk? Navigate to https://www.splunk.com Sign up for a free account on Splunk Login Click on "FREE SPLUNK" Select "Splunk Enterprise" Select the OS on which you want to install. Download the package. In my case I will in installing it on one of the AWS instance. So I will be choosing Linux 64 Bit .rpm. [root@ip ~]#  ls -lrt -rw-r--r-- 1 root root 345022297 Feb 28 07:14 splunk-7.2.4.2-fb30470262e3-linux-2.6-x86_64.rpm Here is my file  splunk-7.2.4.2-fb30470262e3-linux-2.6-x86_64.rpm. Create a user called splunk or whatever you want. Change its password. Give it sudo privileges. Install the rpm which we downloaded.  [splunk@ip opt]$ sudo rpm -ivh splunk-7.2.4.2-fb30470262e3-linux-2.6-x86_64.rpm We trust you have received the usual lecture from the local System Administrator. It usually boils down to these three things:     #1) Respect the privacy of others.     #2) Think before you type.     #3) With gre

Splunk Enterprise Components?

Splunk Enterprise Components? Search Head Basically its a graphical user interface and contains all the dashboards, charts etc. Also it enables us to have a solution to query the data according to our needs. Indexer It is the core component which do all the heavy tasks. Major task is to get the data parsed i.e. your data is broken down into events and stored in the indexer. Used by search head to query the data, once the data is queried all the events based on the search are returned back to the search head. Forwarders Universal For understanding sake you can say it as an agent. Collect data from remote data sources and feed it to Splunk indexer. Example: Flat files, logs (web-server, database). Very small daemon (light weight). Heavy Its heavier than universal forwarder. Additional capabilities of parsing and storing the data. Logically storing on heavy forwarder is not recommended. Parsing means masking of the data (removing secret information like pa

What is Splunk?

What is Splunk? Log management or log collection tool. Infrastructure monitoring tool. Application monitoring tool. Reporting tool. Analytical tool. Operational intelligence. Splunk Products? Splunk Light Lightest version of splunk, contains all basic functionality. Hosted on Splunk infrastructure. Splunk Cloud Contains all the functionality of Splunk. Hosted on Splunk infrastructure. Retention policy depends on your package. Supported by Splunk.Inc. Splunk Enterprise Contains all functionality of Splunk. Hosted on your infrastructure. Retention policy depends on your needs. Supported by Splunk.Inc. Splunk License? Licensing in Splunk is basically based on data ingested per day. i.e. from 00:00 to 23:59  For example: 10GB/Day etc This means 10GB of data is processed by Splunk and stored in one day. There are various types of licenses: Free: 500MB/Day Developer: 10GB/Day Enterprise: Depends on your project requirements.