Posts

Showing posts with the label heavy

Index: Study Splunk

Want to learn about Splunk?, you came to the right spot ;) What does this blog contain so far?  What is Splunk? Splunk Enterprise Components? Installing Splunk? Installing Splunk Universal Forwarder? Walkthrough of Splunk Interface Search Modes Searching in Splunk #1 Splunk sub(commands) [top, rare, fields, table, rename, sort] #2 Splunk sub(commands) [eval, trim, chart, showperc, stats, avg] #3 Splunk sub(commands) [eval, round, trim, stats, ceil, exact, floor, tostring] #4 Splunk sub(commands) [timechart, geostats, iplocation] #5 Splunk sub(Commands) [sendemail, dedup, eval, concatenate, new_field] #6 Splunk sub(Commands) [fields, rename, replace, table, transaction] Bringing data into Splunk Bringing data into Splunk (Continued...) Enable receiving port on Splunk server Dealing with Time Still I am in a process of writing couple of more topics related to Splunk, but you can go thru any of the links given above !! Do let me know if you have...
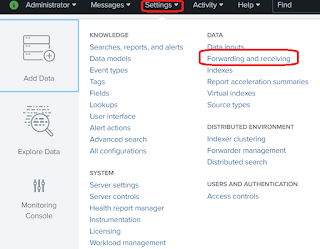
Enable receiving port on Splunk server

Image
Prerequisite: Make sure the port number which you are adding is open and allowed to receive data. There are multiple ways to accomplish this, lets go one by one: CLI: Simplest and easiest way to add a port is via command line interface, you just need to traverse to $SPLUNK_HOME/bin directory and using the splunk universal binary you can do that. [splunk@ip bin]# ./splunk enable listen 9999 Splunk username: admin Password: Listening for Splunk data on TCP port 9999. Above command will require your Splunk admin credentials for adding/enabling the mentioned port number.  PS: If you want to disable it simply use disable instead of enable i.e. ./splunk disable listen 9999, basically what it does it adds a flag in your stanza and mark it as 1 < disabled = 1 >. Basically under the hood what is does, it creates a stanza in your inputs.conf  [splunktcp://9999] connection_host = ip Config file:  Another way to do it, is via ma...

Bringing data into Splunk (Continued...)

What happened behind the hood? When we added the new log file to be monitored via the graphical interface, it created and added a configuration item into inputs.conf configuration file. You can find the configuration file here: $SPLUNK_HOME/etc/apps/search/local/inputs.conf You can also manually edit this file and add your custom stanza, once done to notify Splunk about the changes, the daemon needs to be restarted. It will contain something like this: [monitor:///var/log/messages] disabled = false host = splunk_server index = idx_messages sourcetype = linux_logs Above block is known as stanza, lets decipher this :)  monitor: This is used to specify which logfile(s) you want to monitor i.e. you can mention a specific logfile as well as full directory lets say you want to monitor everything under /var/log directory, just mention "monitor:///var/log/" and Splunk will try to index everything which is there in that directory. disabled: Lets say you w...

Bringing data into Splunk

Image
Now, lets dive deep into bringing data into Splunk. Splunk Enterprise can index any type of data, however it works best with data with timestamps. When Splunk indexes data, it breaks it into events based on timestamps. Every event or data which is indexed into Splunk should have a sourcetype ( helps to identify the type of data which is indexed ) assigned to it. In corporate environment, majorly forwarders ( ref: here ) are used to input data into Splunk but there are other ways as well in which you can get your data indexed to Splunk. Lets assume you want to monitor a log file of the local machine on which Splunk is installed then you can use the hyperlinks which are listed under "Local inputs" otherwise you can use the hyperlinks which are listed under "Forwarded inputs". For achieving that, you can navigate to "Settings" => "Data Inputs" => "Local Inputs" => "Add New" (NOTE: Make sure Splunk have a...

Searching in Splunk

Image
Searching on Splunk is quite simple. Just login to your Splunk Enterprise installation, navigate to App: Search & Reporting . It will bring you to a new web page which is basically our search head. Type in your query and you are done. All your events which matched your query will be presented on your screen, If you will notice below, the query which I have used have nothing much its just searching all the events from "idx_messages" index < remember we added a monitor on one of our remote host to forward the data to idx_messages index   >. Based on above search it resulted in 1068 events in last 7 days. Field names are case sensitive. Field values are not case sensitive, if used without single quotes. i.e. below queries with give us same results: index=idx_messages date_wday=monday  index=idx_messages date_wday=MONDAY index=idx_messages date_wday="MONDAY" But if I use below query it might not give me...

Walkthrough of Splunk Interface

Image
Walkthrough of Splunk Interface Accessible on port 8000 (default) Once installed, it will have some basic applications pre-installed. Contains a wide variety of hyperlinks/tabs to manage and play with you Splunk installation. If you need any sort of help, go to the help menu and there you can find couple of handy options like official documentation etc. Best part is, if you are stuck somewhere go to "Splunk Answers" and shoot your query. Splunk community is quite active and surely will help in getting your issue resolved.

Splunk Enterprise Components?

Splunk Enterprise Components? Search Head Basically its a graphical user interface and contains all the dashboards, charts etc. Also it enables us to have a solution to query the data according to our needs. Indexer It is the core component which do all the heavy tasks. Major task is to get the data parsed i.e. your data is broken down into events and stored in the indexer. Used by search head to query the data, once the data is queried all the events based on the search are returned back to the search head. Forwarders Universal For understanding sake you can say it as an agent. Collect data from remote data sources and feed it to Splunk indexer. Example: Flat files, logs (web-server, database). Very small daemon (light weight). Heavy Its heavier than universal forwarder. Additional capabilities of parsing and storing the data. Logically storing on heavy forwarder is not recommended. Parsing means masking of the data (removing secret information like pa...